Cleveland Heart Disease Risk Prototype
This lab walks through the full Thingbert pipeline: cleaning the UCI Cleveland dataset, benchmarking two classifiers, and sketching how an interactive risk check could live on the site.
Executive Overview
A quick orientation for non-technical readers. The dataset follows 303 patients evaluated for heart disease at Cleveland Clinic and uses their vitals to flag likely disease.
- Population. 303 patient records from the Cleveland Clinic Heart Disease study hosted by the UCI Machine Learning Repository.
- Process. Replaced '?' placeholders with missing values, filled gaps with column medians, and converted the outcome to a simple yes/no indicator.
- Outcome. Logistic regression caught 26 of 28 disease cases on the test set while keeping false alarms to 6; the decision tree missed 5 cases.
- How to read it. Use the cards below for headline numbers, the Feature Guide to decode inputs, and the downloads to inspect the full evaluation.
Snapshot
We cleaned the Cleveland cohort, converted the target to a simple yes/no heart disease indicator, and stacked two baseline models. The scaled logistic regression pipeline produced the strongest balance of sensitivity and specificity.
0.869
Share of correct predictions on the 61-person test set.
242 / 61
Training vs. testing rows after an 80/20 stratified split.
0.93 / 0.81
When the model says "no disease" or "disease", this is how often it is right.
0.82 / 0.93
How many real negatives/positives the model successfully captured.
Precision and recall are listed as no disease / disease. Logistic regression kept false negatives (missed disease) to just 2 cases, an improvement over the decision tree’s 5.
Think of the confusion matrix this way: 27 true negatives, 26 true positives, with 6 false alarms and only 2 missed cases. Those totals come straight from the evaluation file below.
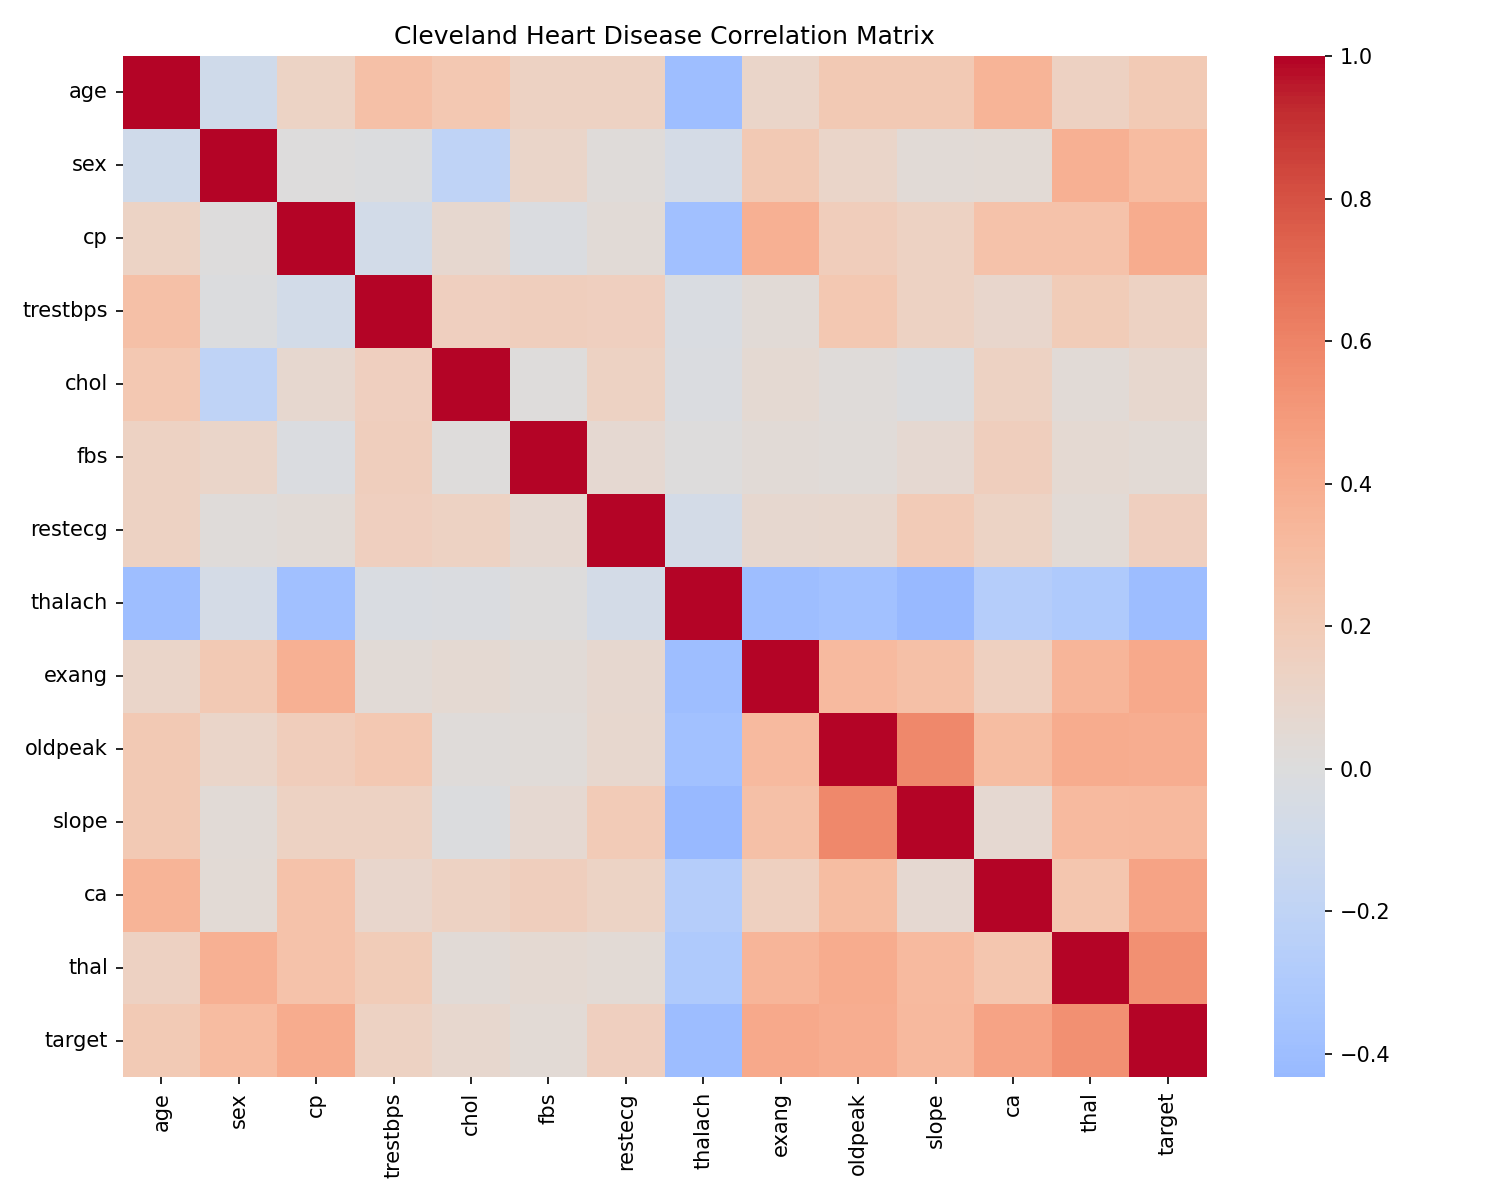
cp), thallium test result (thal), and ST depression (oldpeak) as leading indicators.Feature Guide
Each row is a person who received a heart disease work-up. Use this glossary to decode the variables and interpret the heatmap.
- age
- Age in years at the time of the visit.
- sex
- Biological sex (1 = male, 0 = female).
- cp
- Chest pain type (1 typical angina → 4 asymptomatic).
- trestbps
- Resting blood pressure (mm Hg).
- chol
- Serum cholesterol (mg/dL).
- fbs
- Fasting blood sugar > 120 mg/dL (1 = true).
- restecg
- Resting electrocardiogram (0 = normal, 1 = ST-T abnormality, 2 = probable LV hypertrophy).
- thalach
- Maximum heart rate achieved during exercise.
- exang
- Exercise-induced angina (1 = yes).
- oldpeak
- ST depression induced by exercise relative to rest.
- slope
- Slope of the peak exercise ST segment (1 upsloping, 2 flat, 3 downsloping).
- ca
- Count of major vessels (0–3) shown via fluoroscopy.
- thal
- Thallium stress-test result (3 normal, 6 fixed defect, 7 reversible defect).
- target
- Thingbert label: 1 = heart disease present, 0 = no heart disease.
1. Workflow Summary
Use these talking points when you need to walk stakeholders through the approach.
- Data hygiene. Replaced
?placeholders with missing values, filled numeric gaps with column medians, and recast the outcome to disease present vs. not present. - Model line-up. Compared a standardised logistic regression (balanced class weights) with a shallow decision tree to keep the story interpretable.
- Performance in context. Logistic regression is the safer choice here—it missed only 2 disease cases on the test set, compared with 5 misses from the tree.
- What drives risk. Chest pain type (
cp), thallium test result (thal), and exercise-induced ST depression (oldpeak) carry the strongest signals. - Caveats. Sample size is modest and sourced from a single clinic; treat outputs as illustrative benchmarks, not clinical guidance.
2. Technical Appendix
For analysts, here are the holdout metrics for each model. Precision and recall values are shown as no disease / disease.
| Model | Accuracy | Precision | Recall | Confusion matrix | Notes |
|---|---|---|---|---|---|
| Logistic regression | 0.869 | 0.93 / 0.81 | 0.82 / 0.93 | [[27, 6], [2, 26]] |
Standardised features, balanced class weights (liblinear solver). |
| Decision tree | 0.770 | 0.83 / 0.72 | 0.73 / 0.82 | [[24, 9], [5, 23]] |
Depth 4, min leaf 5 with class balancing; higher variance, more missed cases. |
Recreate the run by loading heart_disease/heart_disease_model.pkl with joblib.load and calling model.predict on the cleaned dataset.
3. Heart Risk Estimator (Beta)
Plug in the same inputs used in the model to see the logistic regression probability. This demo runs entirely in your browser; nothing is stored or transmitted.
4. Download the Analysis Files
Same artifacts we used internally—ideal for replicating the workflow or reviewing the numbers in detail.
5. Implementation Roadmap
To graduate the in-browser demo into a production experience, follow this path.
- Expose an API (FastAPI or Flask) that loads the serialized logistic regression pipeline and validates user inputs.
- Design a lightweight intake form (age, sex, chest pain type, vitals, exercise response) that mirrors the model features.
- Return risk probabilities with guardrails: flag inputs outside training ranges, display calibration notes, and surface the confusion matrix for context.
- Add analytics tracking to gauge engagement and iterate on the question flow before promoting broadly.
The trained pipeline lives in the working repo at heart_disease/heart_disease_model.pkl. Wire it into a microservice when you are ready to test the interaction.